Ensure production readiness
This guide will walk you through configuring production readiness standards for your services.
You'll learn how to track metrics like on-call coverage and code ownership, and integrate them with your deployment process.
🎬 If you would like to follow along to a video that implements this guide, check out this one by @TeKanAid 🎬
Common use cases
- Platform engineers will be able to define clear policies for services, and automatically pass/fail releases accordingly.
- Developers will be able to easily see which policies are not met, and what they need to fix.
- R&D managers will have a bird's-eye view of service health and compliance.
Prerequisites
- This guide assumes you have a Port account and that you have finished the onboarding process. We will use the
serviceblueprint that was created during the onboarding process. - The Git Integration that is relevant for you needs to be installed.
- The PagerDuty integration needs to be installed.
Set up data model
When you install the PagerDuty and Git integration, Port will automatically add the following properties to your service blueprint:
pagerduty_oncall: Shows the current on-call for the service (from PagerDuty)require_code_owner_review: Indicates if code owner review is required (from Git)
We'll use these properties in our metrics to track production readiness standards.
Configure PagerDuty service mapping
To ensure your PagerDuty services are correctly mapped to your Port services, you'll need to configure the mapping in your PagerDuty integration. This will allow Port to automatically discover and relate PagerDuty services to your existing service entities.
-
Go to your data sources page and click on your PagerDuty integration

-
Add the following mapping configuration:
- kind: services
  selector:
    query: "true"
  port:
    entity:
      mappings:
        identifier: .name | gsub("[^a-zA-Z0-9@_.:/=-]"; "-") | tostring
        title: .name
        blueprint: '"service"'
        properties: {}
        relations:
          pager_duty_service: .id
Update your existing service's scorecard
Now let's use the mirror properties created from the pagerduty and git installations to set standards for our services.
Say we want to ensure each service meets our new requirements, with different levels of importance. Our Service blueprint already has a scorecard called Production readiness, with three rules.
Let's add our metrics to it:
Bronze- each service must have aReadmeSilver- each service must have code owner reviews enabledGold- each service must have an on-call defined
Now let's implement it:
-
Go to your Builder, choose the
Serviceblueprint, click onScorecards, then click our existingProduction readinessscorecard: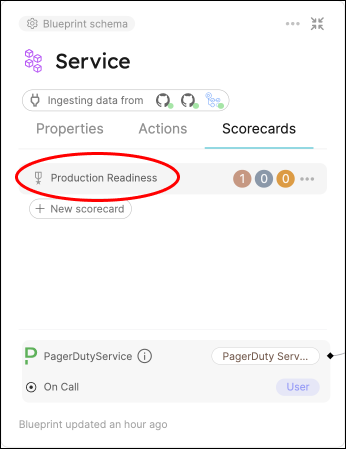
-
Replace the content with this, then click
Save:Scorecard schema (click to expand)
{
  "identifier": "ProductionReadiness",
  "title": "Production Readiness",
  "rules": [
    {
      "identifier": "hasReadme",
      "description": "Checks if the service has a readme file in the repository",
      "title": "Has a readme",
      "level": "Bronze",
      "query": {
        "combinator": "and",
        "conditions": [
          {
            "operator": "isNotEmpty",
            "property": "readme"
          }
        ]
      }
    },
    {
      "identifier": "fressnessUnderYear",
      "description": "Checks that the last PR merged is less than a year ago",
      "title": "Freshness < year",
      "level": "B",
      "query": {
        "combinator": "and",
        "conditions": [
          {
            "operator": "<",
            "property": "freshness",
            "value": 366
          }
        ]
      }
    },
    {
      "identifier": "fressnessUnder90",
      "description": "Checks that the last PR merged is less than 90 days ago",
      "title": "Freshness < 90 days",
      "level": "B",
      "query": {
        "combinator": "and",
        "conditions": [
          {
            "operator": "<",
            "property": "freshness",
            "value": 90
          }
        ]
      }
    },
    {
      "identifier": "fressnessUnder30",
      "description": "Checks that the last PR merged is less than 30 days ago",
      "title": "Freshness < 30 days",
      "level": "A",
      "query": {
        "combinator": "and",
        "conditions": [
          {
            "operator": "<",
            "property": "freshness",
            "value": 30
          }
        ]
      }
    },
    {
      "identifier": "branchProtection",
      "description": "Checks if the repository have required approvals",
      "title": "Branch protection set",
      "level": "B",
      "query": {
        "combinator": "and",
        "conditions": [
          {
            "operator": ">",
            "property": "required_approvals_for_pr",
            "value": 0
          }
        ]
      }
    },
    {
      "identifier": "ownerProtection",
      "description": "Checks if the repository have required approval from code owners",
      "title": "Branch protection set",
      "level": "A",
      "query": {
        "combinator": "and",
        "conditions": [
          {
            "operator": "=",
            "property": "require_code_owner_review",
            "value": "true"
          }
        ]
      }
    },
    {
      "identifier": "hasTeam",
      "description": "Checks if the service has a team that owns it (according to the \"Team\" property of the service)",
      "title": "Has a Team",
      "level": "Gold",
      "query": {
        "combinator": "and",
        "conditions": [
          {
            "operator": "isNotEmpty",
            "property": "$team"
          }
        ]
      }
    },
    {
      "identifier": "hasOncall",
      "title": "Has On-call",
      "level": "Gold",
      "query": {
        "combinator": "and",
        "conditions": [
          {
            "operator": "isNotEmpty",
            "property": "pagerduty_oncall"
          }
        ]
      }
    }
  ]
} -
Now go to your Catalog and click on any of your services.
-
Click on the
Scorecardstab and you will see the score of the service, with details of which checks passed/failed: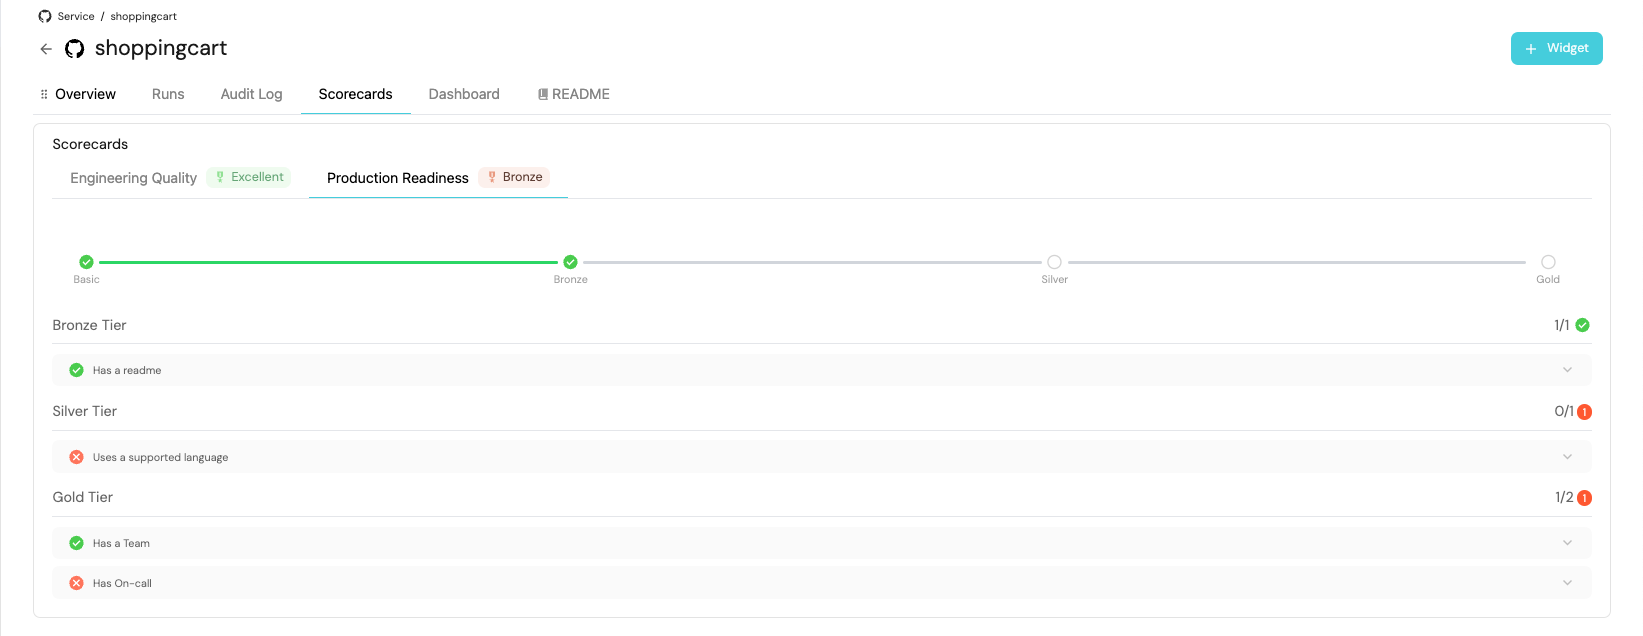
Visualization
By leveraging Port's dashboards, you can create custom views to track your production readiness metrics and monitor your services' compliance over time.
Dashboard setup
-
Go to your software catalog.
-
Click on the
+ Newbutton in the left sidebar. -
Select New dashboard.
-
Name the dashboard Production Readiness Metrics.
-
Choose an icon (optional).
-
Click on
Create.
Add widgets
In your new dashboard, create the following widgets:
Production readiness overview (click to expand)
-
Click
+ Widgetand select Table. -
Type
Production readiness overviewin the Title field. -
Choose an icon (optional).
-
Choose Service as the Blueprint.
-
Click on
Save. -
Click on the
...on the widget and selectCustomize table. -
Click on the
Group by any Columnicon and select Production Readiness. -
Click on
Manage propertiesand add the following:- Title
- Lifecycle
- Passed scorecard rule
- Has a readme
-
Click on the
Saveicon.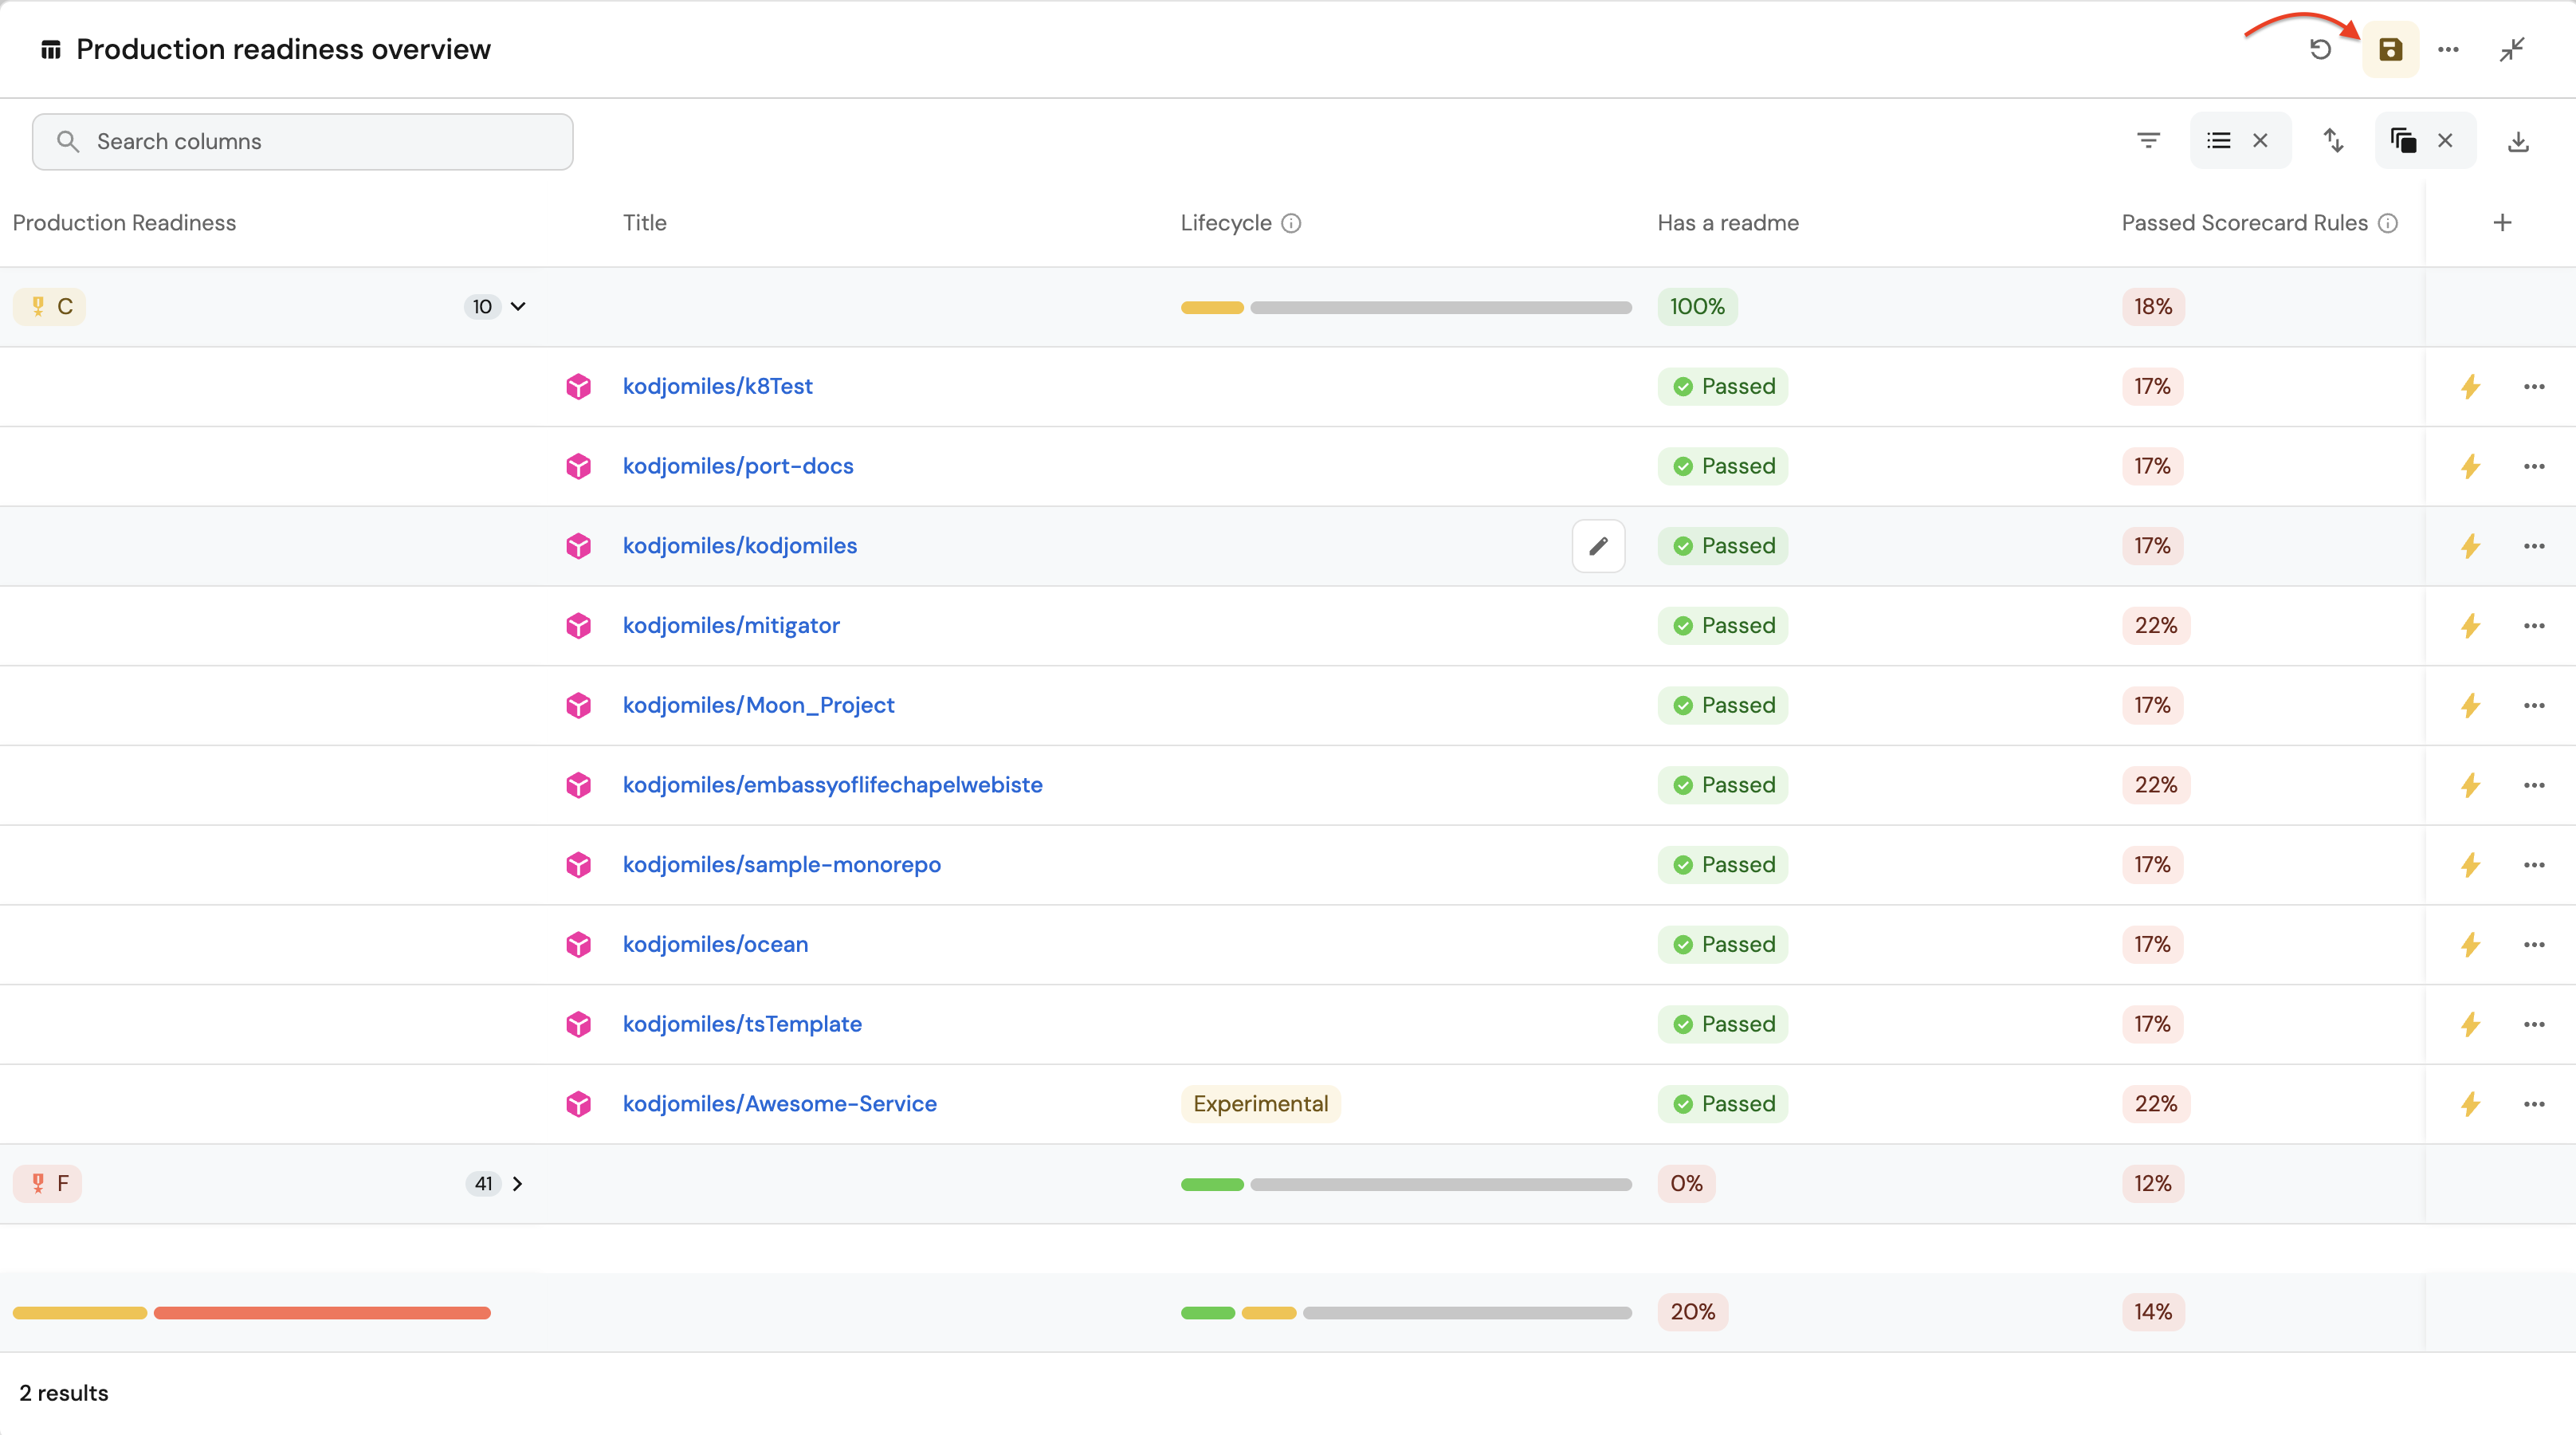
On-call coverage (click to expand)
-
Click
+ Widgetand select Pie Chart. -
Type
On-call coveragein the Title field. -
Choose an icon (optional).
-
Choose Service as the Blueprint.
-
Choose
Pagerduty On-callas the Breakdown by property. -
Click on
Save.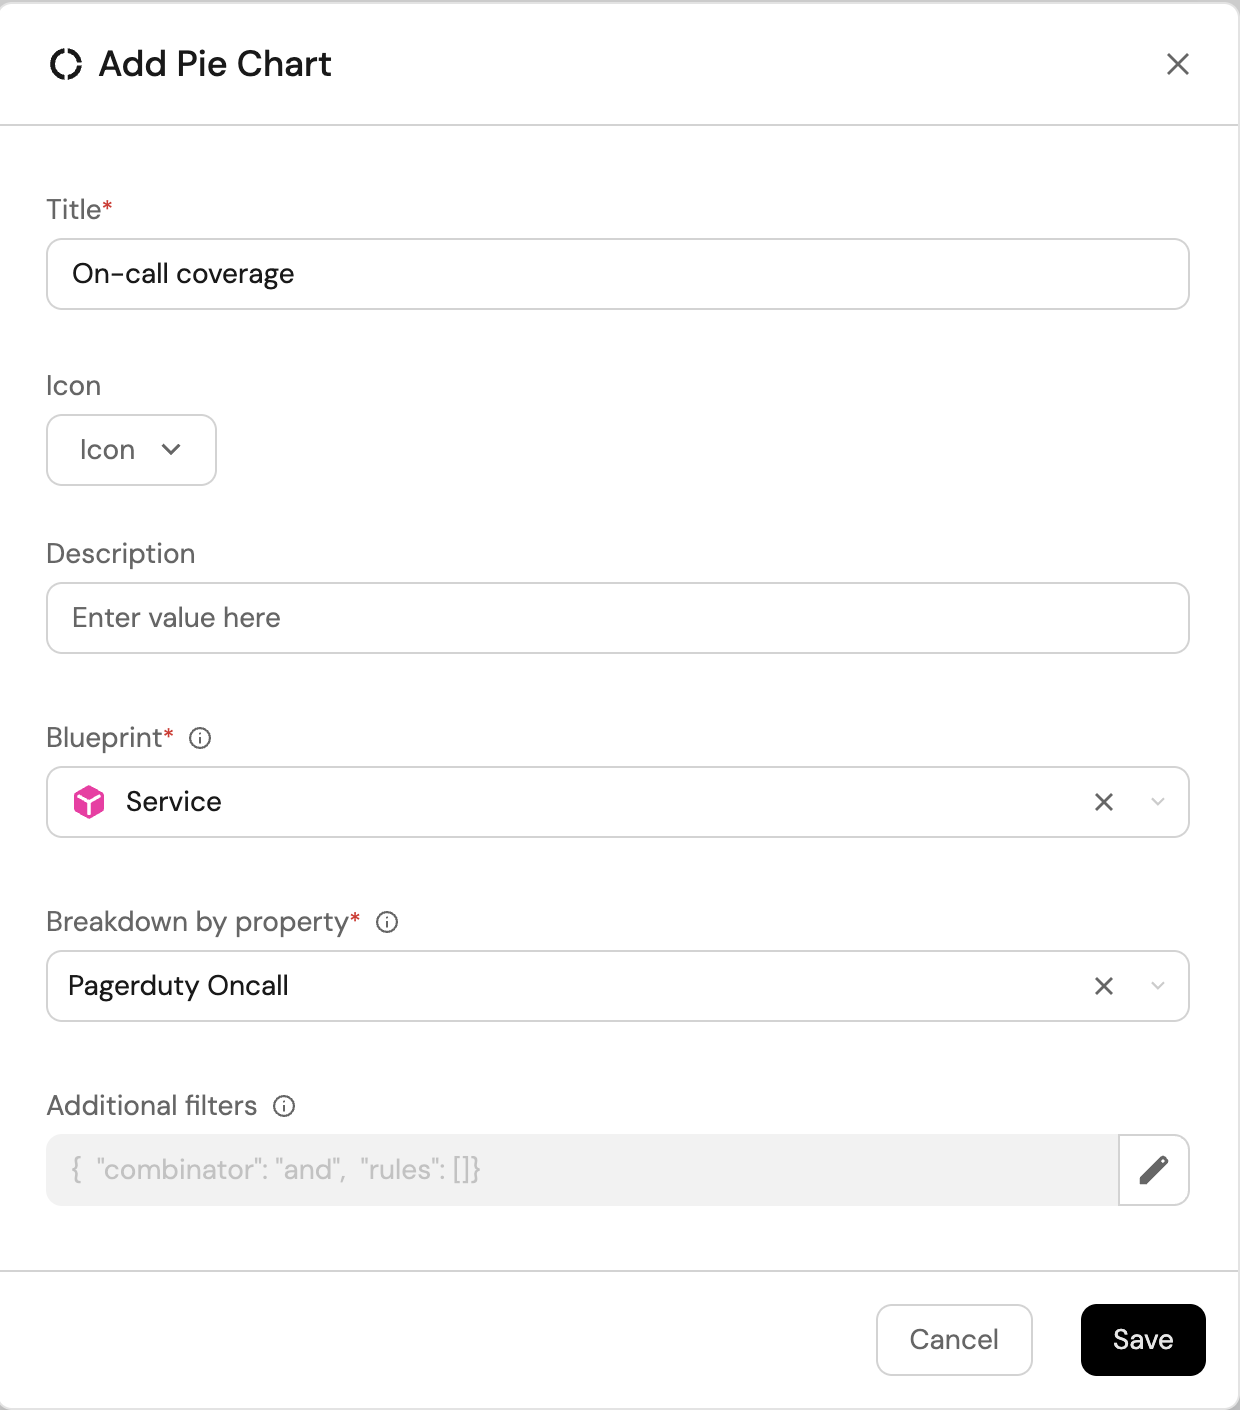
Branch protection status (click to expand)
-
Click
+ Widgetand select Table. -
Type
Branch protection statusin the Title field. -
Choose an icon (optional).
-
Choose Service as the Blueprint.
-
Click on
Save. -
Click on the
...on the widget and selectCustomize table. -
Click on the
Group by any Columnicon and select Branch Protection Status. -
Click on
Manage propertiesand add the following:- Title
- Required Approvals (required_approvals_for_pr)
- Code Owner Review Required (require_code_owner_review)
-
Click on the
Saveicon.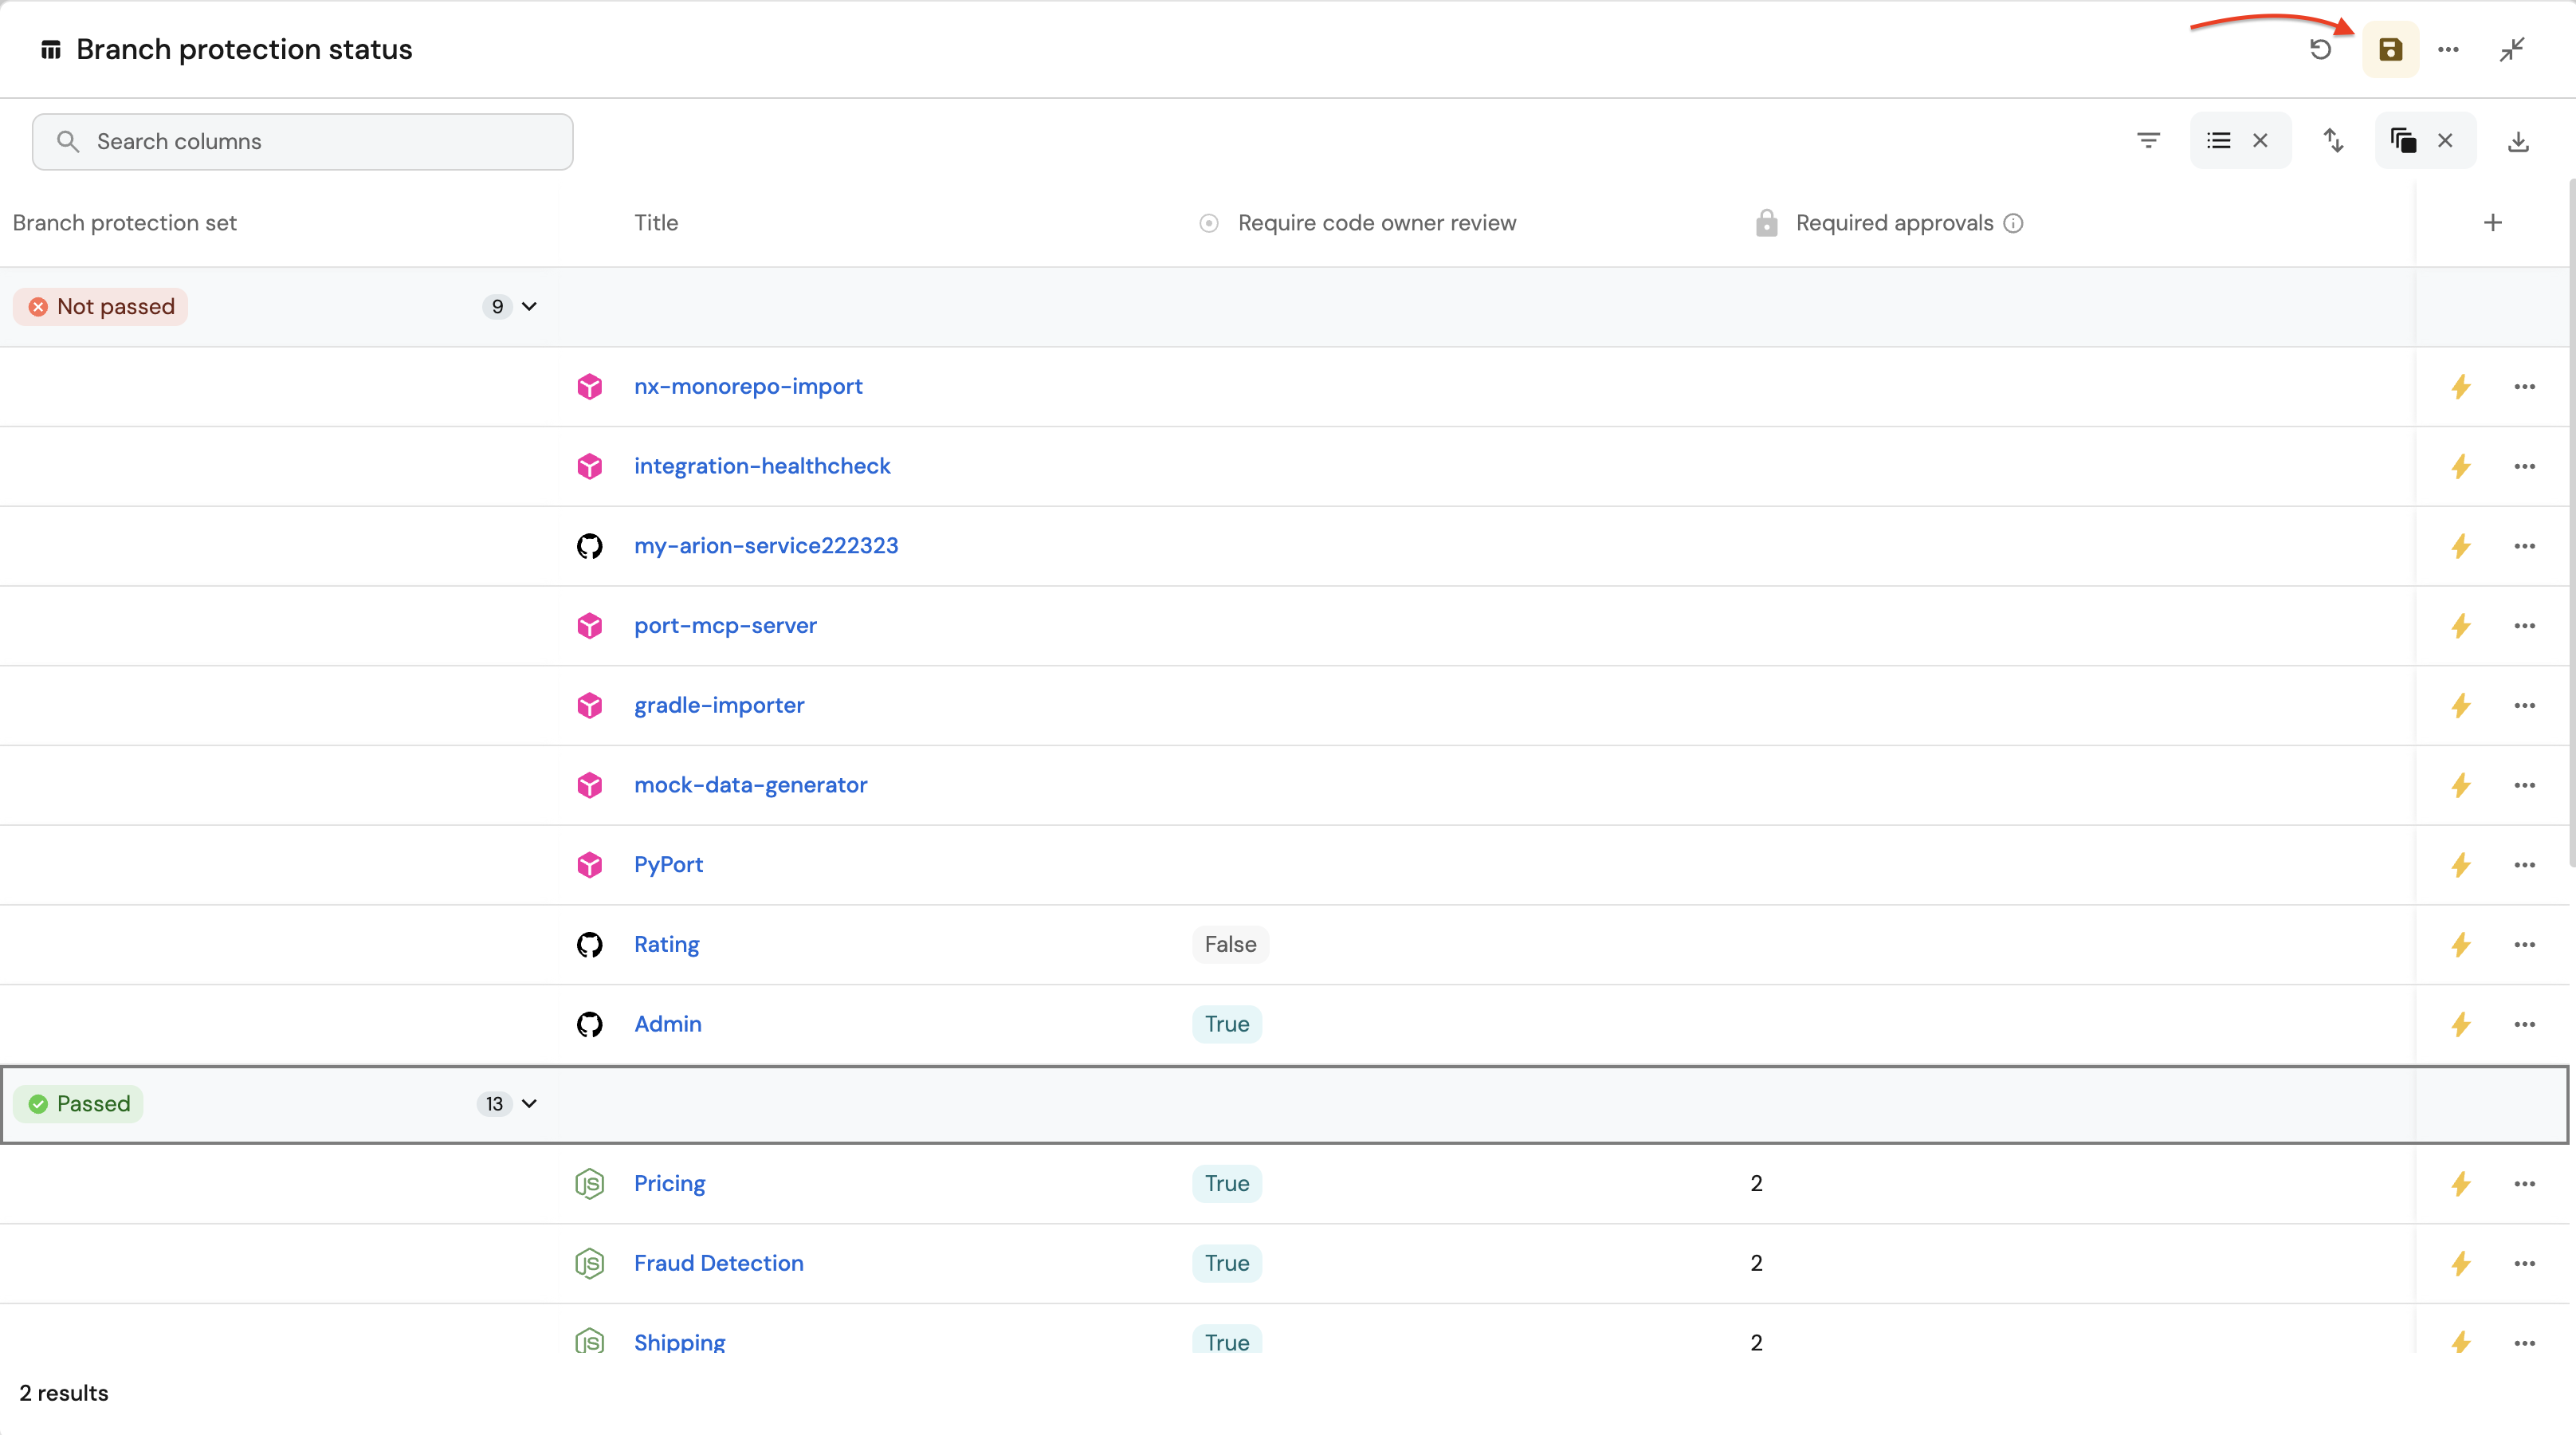
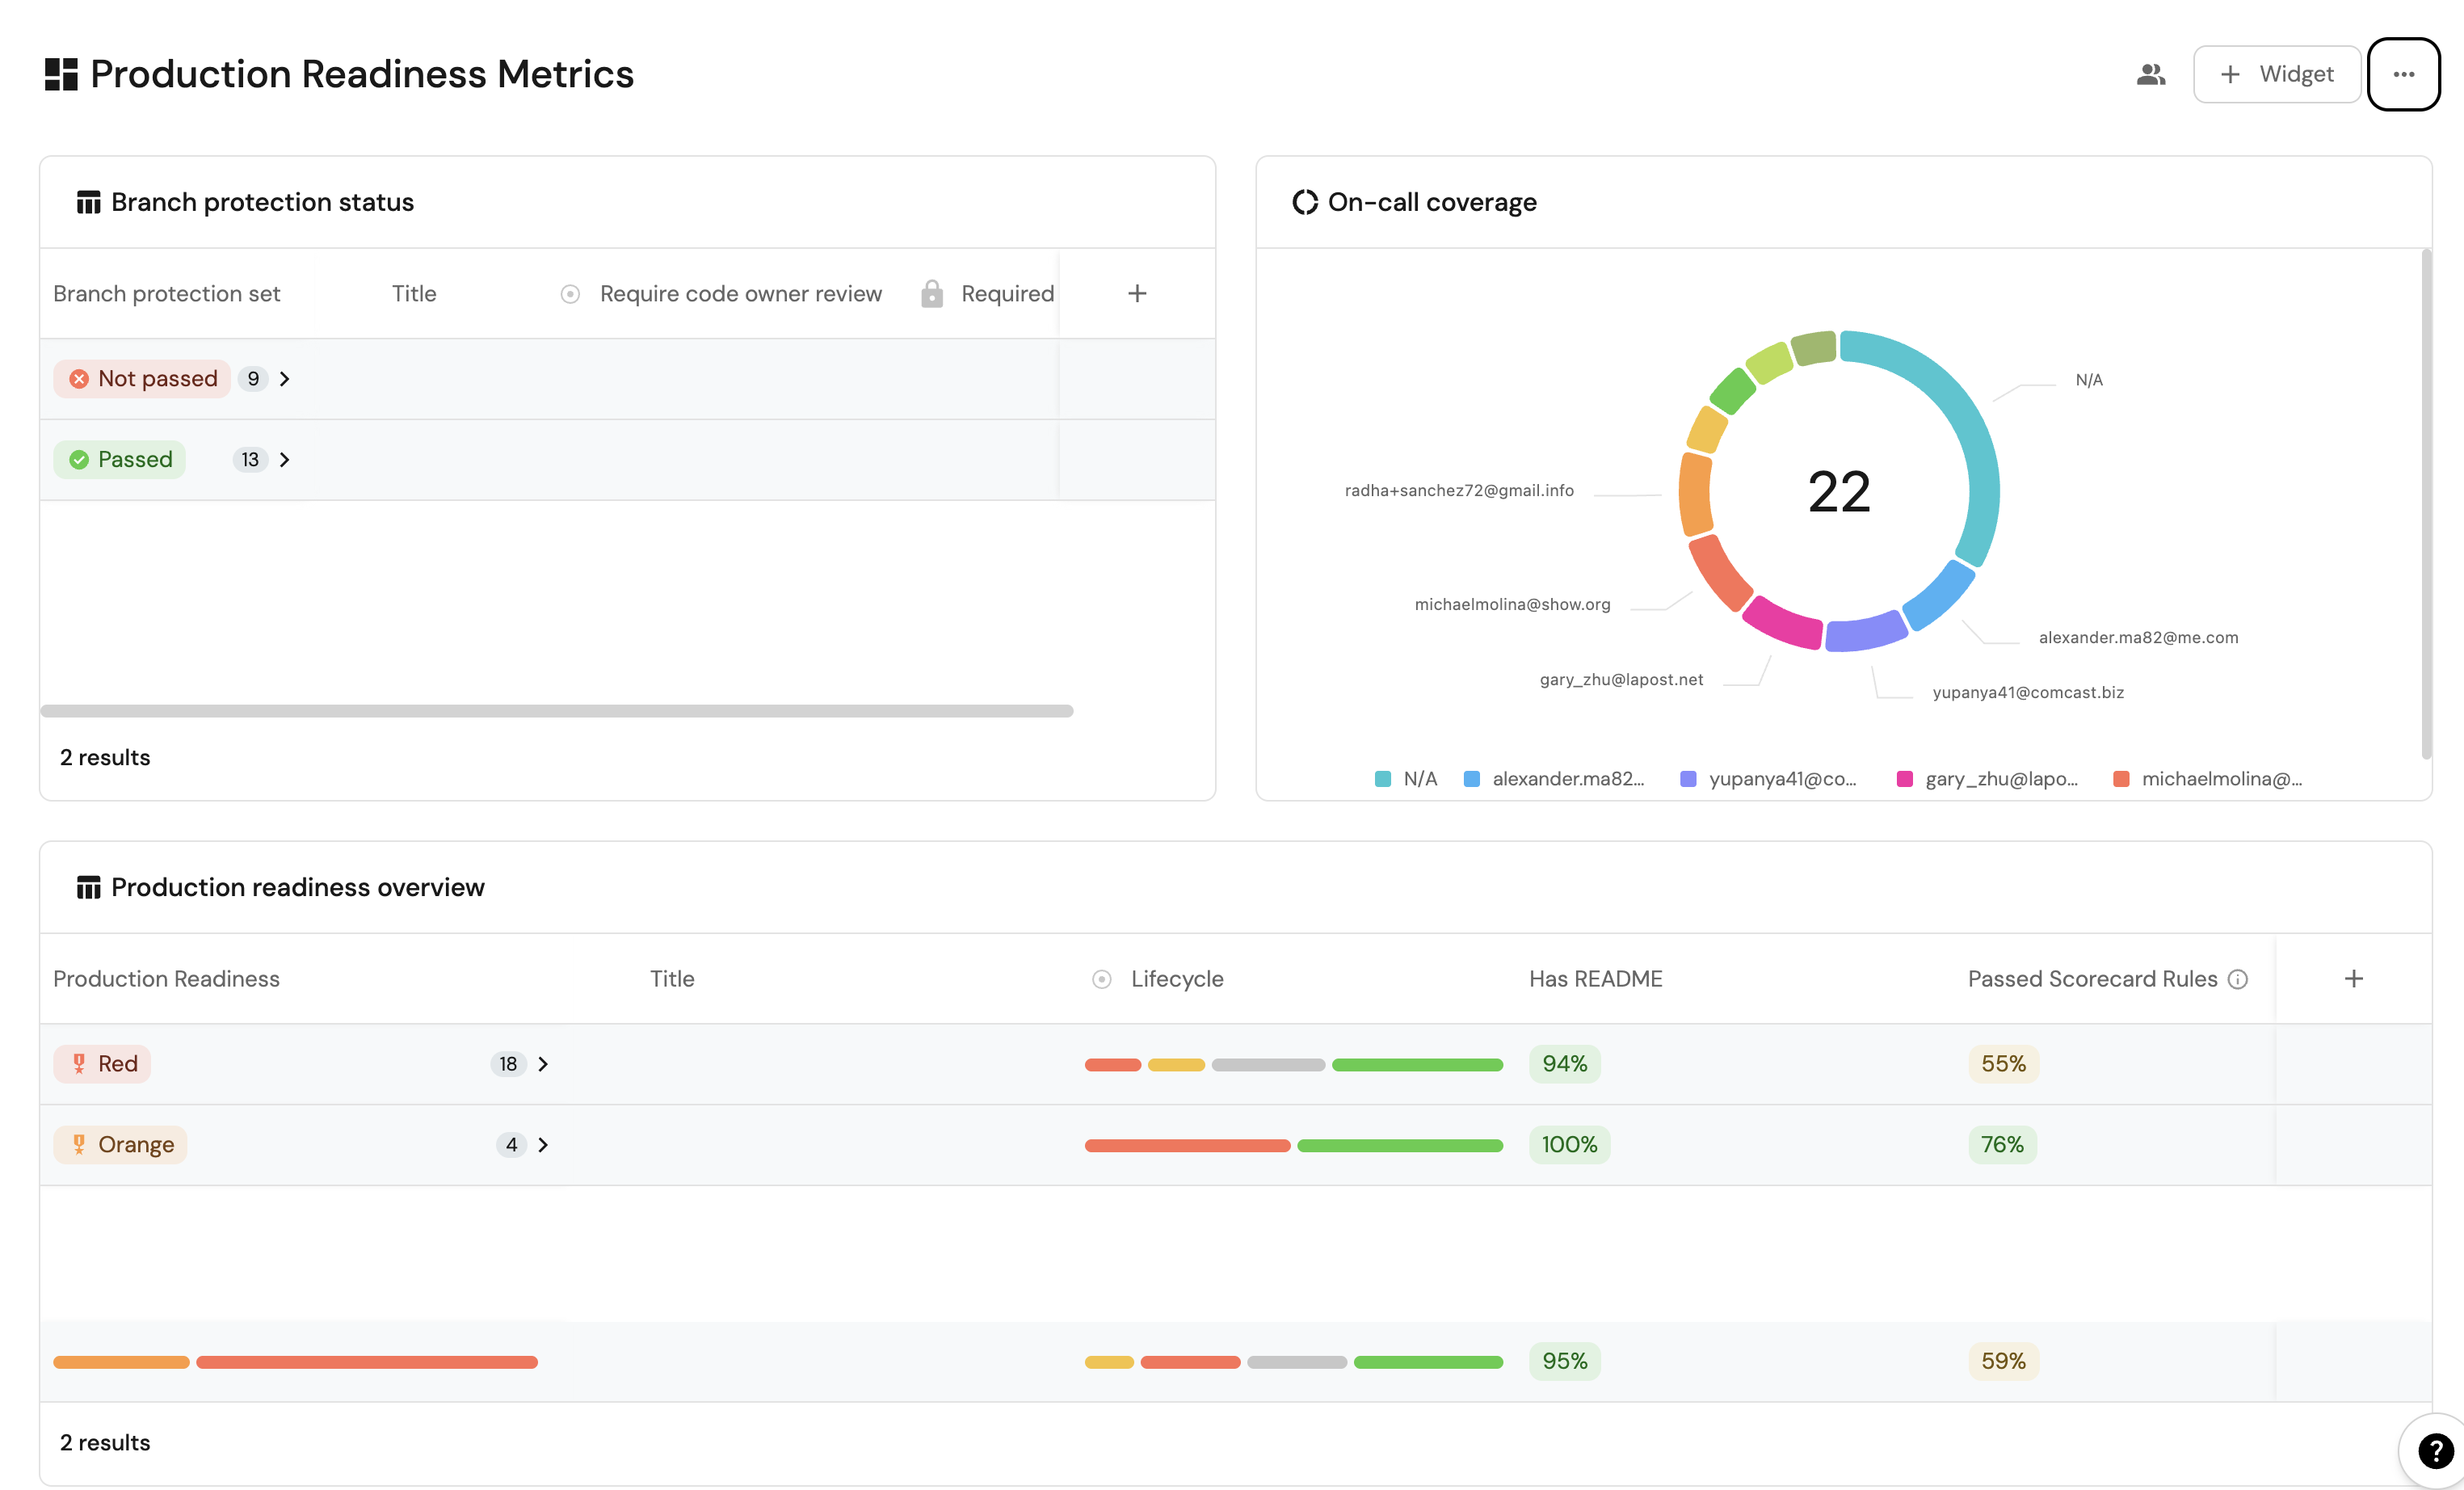
These widgets will give you a comprehensive view of your services' production readiness status, making it easy to identify areas that need attention.
Possible daily routine integrations
- Use Port's API to check for scorecard compliance from your CI and pass/fail it accordingly.
- Notify periodically via Slack about services that fail gold/silver/bronze validations.
- Send a weekly/monthly report for managers showing the number of services that do not meet specific standards.
Conclusion
Production readiness is something that needs to be monitored and handled constantly. In a microservice-heavy environment, things like codeowners and on-call management are critical.
With Port, standards are easy to set-up, prioritize and track. Using Port's API, you can also create/get/modify your scorecards from anywhere, allowing seamless integration with other platforms and services in your environment.
More relevant guides and examples: